
📊 Full opportunity report: The $725 Billion Question: Hyperscaler Capex Q1 2026 and What the Earnings Don’t Answer on ThorstenMeyerAI.com — validation score, market gap, and execution plan.
TL;DR
In Q1 2026, Microsoft, Amazon, Alphabet, and Meta announced a combined AI infrastructure investment of approximately $725 billion, the largest in history. Despite strong capex growth, market concerns persist over whether this spending will yield proportional revenue gains.
On April 29, 2026, Microsoft, Amazon, Alphabet, and Meta disclosed their Q1 2026 earnings, revealing a combined AI infrastructure capital expenditure of around $725 billion, the largest in corporate history. This record spend underscores the aggressive push into AI and cloud infrastructure but also raises questions about whether this investment will translate into the revenue and earnings growth that markets anticipate.
The four companies reported robust earnings, with Microsoft projecting a full-year capex of approximately $190 billion, Amazon reaffirming its $200 billion guidance, Alphabet estimating around $185 billion, and Meta raising its capex estimate to between $125 billion and $145 billion. Collectively, their capex increased by 69% year-over-year, with a significant portion allocated to GPUs, CPUs, and networking infrastructure.
Despite the record investment, NVIDIA’s stock declined sharply after these earnings, as investors questioned whether GPUs remain the primary bottleneck for AI deployment or if other factors—such as power, cooling, or proprietary silicon—are now limiting growth. The market is also scrutinizing whether the massive capex will result in proportional revenue increases, or if structural challenges will lead to an impairment cycle in the coming years.
$725 billion. The question capex doesn’t answer.
April 29, 2026. Largest capital-expenditure cycle in modern tech history. Lock-in across the Big Four.
Microsoft $190B. Amazon $200B. Alphabet $185B. Meta $125-145B. Up from $670B high-end consensus going in. +69% YoY surge over 2025. NVIDIA fell on the news. The structural questions — depreciation, power, in-house silicon, demand-pull, geopolitical — resolve through 2027-2028.
Four hyperscalers. $725B committed.
Each hyperscaler beat-and-raised in the same 24-hour window April 29. Microsoft / Amazon / Alphabet / Meta. The capex commitment is non-discretionary at this scale — companies cannot back out without creating asset write-downs and capacity gaps.

AI Systems Performance Engineering: Optimizing Model Training and Inference Workloads with GPUs, CUDA, and PyTorch
As an affiliate, we earn on qualifying purchases.
As an affiliate, we earn on qualifying purchases.
Three paths. One question.
The capex buildout resolves through one of three structural paths. The honest assessment: the demand signals are real, the supply signals are real, and the balance between them is the structural question.
- Demand +60-100% YoYEnterprise translates fully.
- Utilization 85%+NVIDIA pricing power holds.
- $2.8T by 2028Jensen trajectory matches.
- No impairmentCapex fully accretive.
- Outcome: Multiples expand. Foundation for next decade.
- Demand +30-60% YoYPartial translation.
- Utilization 75-85%Weaker pockets visible.
- NVDA decel 75% → 30-50%Manageable adjustment.
- $30-80B impairmentLimited 2028 cycles.
- Outcome: Multiples compress modestly. No crisis.
- Demand +15-30% YoYEnterprise falls short.
- Utilization 65-75%Capacity glut visible.
- $150-300B impairmentBig Four 2027-2028.
- NVDA sharp decelPricing compression.
- Outcome: 30-50% multiple compression. Post-2001 telecom analog.
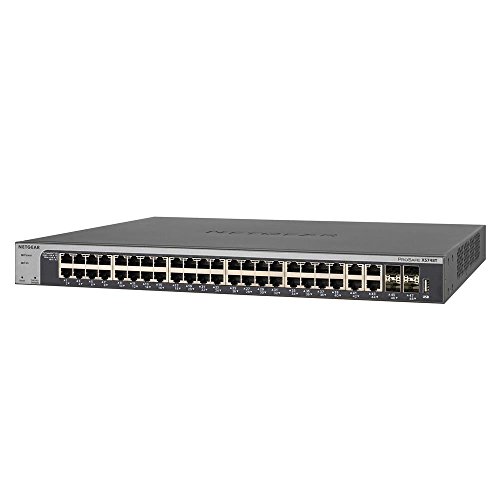
NETGEAR 48-Port 10G Ethernet Smart Switch (XS748T) – Managed, with 4 x 10 Gigabit SFP+, Desktop or Rackmount, and Limited Lifetime Protection
44 x 10-Gigabit Copper + 4 x dedicated 10-Gigabit SFP+ ports for connections to 10G-capable servers and NAS
As an affiliate, we earn on qualifying purchases.
As an affiliate, we earn on qualifying purchases.
Five vectors. Interdependent.
Capital-allocation risks of this magnitude resolve through specific structural channels. The vectors are not independent — power constraints delay deployment which compresses utilization which triggers impairment.
Capital intensity has reset upward as the new baseline for tech-platform leadership. The competitive moat is partly capital availability rather than purely product or technology innovation. Tech-platform leadership now requires capital-deployment scale that fewer companies can execute.
power-efficient CPUs for cloud infrastructure
As an affiliate, we earn on qualifying purchases.
As an affiliate, we earn on qualifying purchases.
Four assignments. By role.
Reset on structural pricing-power compression.
Bull case requires NVIDIA to maintain addressable share through FY27-FY28; in-house silicon migration argues that share compresses. Position accordingly. Consider AMD, Broadcom, downstream networking suppliers as partial substitutes that may benefit from compression. Stop pricing the $2.8T-by-2028 ceiling literally.
Treat capex as tailwind and risk factor.
Microsoft best-positioned through capacity-constrained Azure demand. Alphabet best-positioned through TPU silicon independence. Amazon best-positioned through Trainium/Inferentia revenue diversification. Meta most exposed through internal-product-only revenue offset. Position differentially rather than treating Big Four as equivalent.
Use the buildout to negotiate.
Capacity becoming abundant; pricing under structural pressure. 2-3 year contracts with capacity guarantees + price-discount escalators that capture unit-cost reduction as buildout absorbs. Multi-cloud sourcing more attractive as capacity scarcity ends. The negotiating window opens through 2026-2027.
Plan for capacity glut by H2 2027.
Capex commitment produces more compute than current demand absorbs at current pricing. API pricing pressure compounds through 2027-2028. China sphere cost gap (5-30× cheaper) makes more acute. Margin guidance for next 18 months should explicitly model capacity-driven price compression. Hedge accordingly in S-1 disclosures.

The Data Center Engineering Handbook: A Practical Guide to Infrastructure Design, Power Systems, Cooling, Security, Compliance, and Operational Excellence
As an affiliate, we earn on qualifying purchases.
As an affiliate, we earn on qualifying purchases.
Implications of Record AI Infrastructure Spending
This historic $725 billion capex cycle signals a fundamental shift in AI and cloud infrastructure investment, with hyperscalers outspending their free cash flow and increasing debt to fund their buildouts. While this demonstrates strong commitment to AI leadership, it also raises concerns about the efficiency of such spending and whether it will deliver the expected revenue and profit growth. The ongoing market skepticism over GPU constraints and the potential for revenue saturation could influence stock valuations and future investment strategies.
Historical and Strategic Context of Hyperscaler Investment
Prior to 2026, hyperscalers increased their capex significantly, driven by AI and cloud growth. The combined spend, reaching nearly $740 billion globally according to Morgan Stanley, reflects a structural shift, with companies doubling their capex-to-revenue ratios from pre-AI levels of 10-15% to around 25-30%. Notably, Microsoft, Amazon, and Alphabet have all increased debt issuance to finance these investments, indicating a long-term strategic commitment rather than short-term discretionary spending.
This investment surge is also linked to the evolving compute landscape, where NVIDIA’s GPUs have historically been central. However, recent market reactions suggest doubts about whether GPUs alone will sustain AI growth, as companies explore in-house silicon, power efficiency, and alternative architectures like Google’s TPU and Amazon’s Trainium.
“Our plan remains largely unchanged, with a $200 billion capex for 2026, emphasizing our shift to in-house silicon for AI workloads.”
— Andy Jassy, Amazon CEO
“Our TPU v6 ramp will be a key factor in serving AI compute needs without relying solely on NVIDIA.”
— Alphabet CFO
Unresolved Questions About Revenue Impact
It remains unclear whether the massive capex will translate into proportional revenue and earnings growth in the near term. Market concerns center on whether GPU constraints are easing, if in-house silicon is gaining traction, or if structural challenges such as power, cooling, and supply chain issues will dampen expected returns. The potential for an impairment cycle as depreciation catches up with revenue growth is also uncertain.
Upcoming Milestones and Market Reactions
Investors will closely monitor the upcoming quarterly reports for evidence of revenue growth driven by the increased infrastructure. Further updates on in-house silicon adoption, capacity expansion, and GPU supply chain developments will influence market sentiment. Additionally, any shifts in debt levels or capex guidance from the hyperscalers will be critical indicators of their strategic outlook.
Key Questions
Will the $725 billion capex lead to higher revenues in 2026?
It is uncertain whether the increased investment will directly translate into proportional revenue growth, as structural challenges and market dynamics remain uncertain.
Why did NVIDIA’s stock fall after the earnings reports?
Investors questioned whether GPUs are still the primary bottleneck for AI deployment or if other factors, such as power and proprietary silicon, are limiting growth.
How are the hyperscalers funding this record investment?
They are outspending their free cash flow and increasing debt issuance to finance their infrastructure expansion.
What role do in-house silicon and alternative architectures play?
Companies like Google and Amazon are developing and deploying their own AI chips, which could reduce dependence on NVIDIA and alter the supply-demand dynamics for GPUs.
What are the risks of this level of investment?
The main risks include overcapacity, diminishing returns, and potential impairments if revenue growth does not meet expectations.
Source: ThorstenMeyerAI.com